KRI vs KPI: the real difference and how to use both

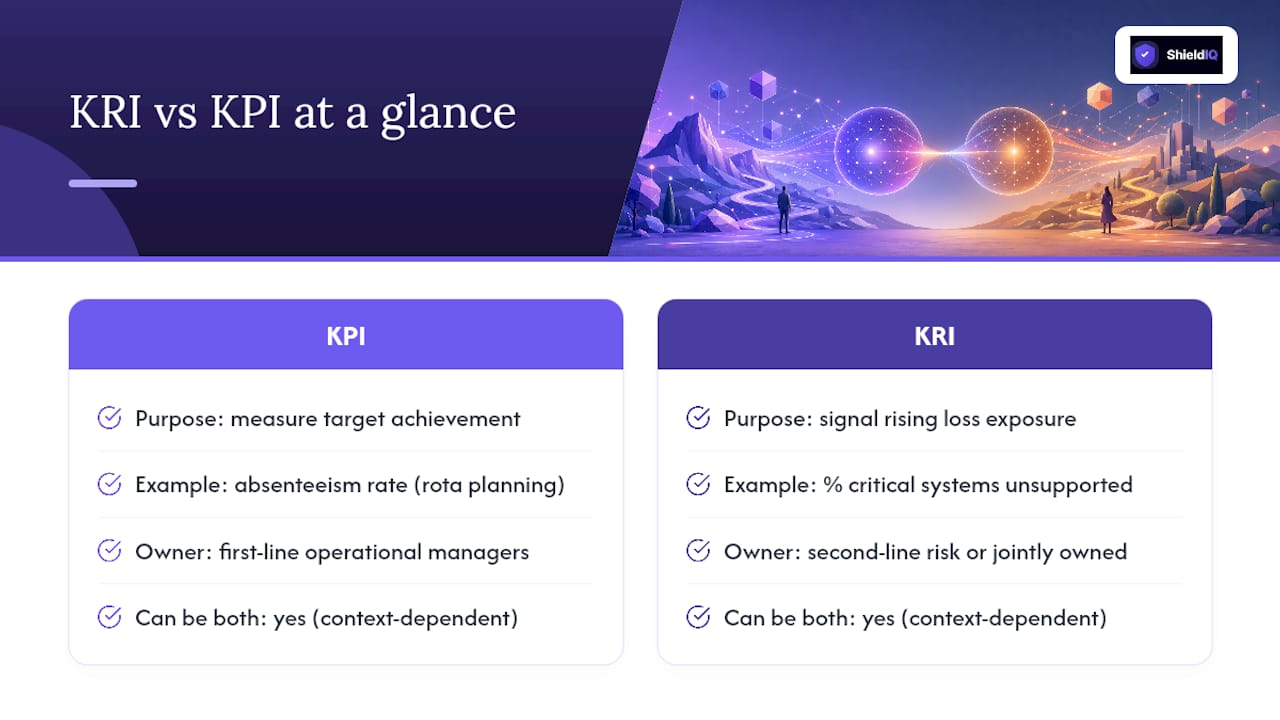
A KPI measures how well you are meeting an objective. A KRI warns you that your exposure to loss is rising before that loss happens. One looks backward at achievement; the other looks forward at threat.
Put them side by side and the difference becomes obvious. A bank onboarding new customers might track "new accounts opened this month" as a KPI, "percentage of new accounts opened without completed KYC checks" as a KRI, and "percentage of daily reconciliations completed by T+1" as a KCI, the control metric that sits between the two. The KPI tells you growth is healthy. The KRI tells you that growth might be outrunning your controls.
Frameworks like NIST SP 800-53 Rev 5 formalise this logic for control measurement, and structured exercises such as an RCSA (risk and control self-assessment) workshop are how most EU risk teams actually pick their indicators. Platforms such as ShieldIQ exist precisely to operationalise that split, so thresholds and escalation don't live only in someone's head.
Key Takeaways
A KPI confirms whether you're hitting a target, while a KRI warns you that your exposure to a loss event is rising before it happens, and pairing the two closes the gap that produced failures like Wells Fargo's cross-selling scandal.
| Point | Details |
|---|---|
| Core distinction | KPIs measure achievement against a target; KRIs signal rising exposure to a specific loss event. |
| Ownership split | Keep KPI ownership with first-line managers and KRI ownership with second-line or shared, escalated risk functions. |
| Thresholds need anchoring | Calibrate KRI bands against risk appetite and back-test them against past incidents before rollout. |
| Same metric, two roles | Split ambiguous metrics like absenteeism into a KPI version and a KRI version rather than reporting one blended number. |
| Start with a pilot | ShieldIQ supports piloting a small indicator set with automated thresholding, escalation workflows and audit-ready reporting across NIS2, GDPR and DORA. |
Table of Contents
- KRI vs KPI: clear definitions you can apply today
- How do KPIs, KRIs and KCIs compare side by side?
- What are concrete KRI and KPI examples by function?
- How do you design and validate a KRI or KPI from scratch?
- What goes wrong when KPI and KRI get confused?
- What does a practical implementation checklist look like?
- Why do KCIs matter for bridging controls and risk?
- How can a GRC platform operationalise these indicators?
- What do practitioners actually do differently in practice?
- Ready to move from spreadsheets to an audit-ready indicator programme?
- Frequently asked questions
- Sources
KRI vs KPI: clear definitions you can apply today
A KPI measures whether you're hitting a target tied to a business objective. Sales revenue, time-to-hire, customer satisfaction scores, uptime percentage. First-line managers own KPIs, and they get reviewed in operational meetings: sales reviews, ops stand-ups, service desk huddles. KPIs are largely lagging or present-tense: they tell you what already happened or what's happening right now.
A KRI signals that your exposure to a specific loss event is increasing, before that loss materialises. According to RiskHub's definition, a KRI is a measurable metric providing insight into a firm's exposure to operational risk, and it should belong to a small, curated set tied to formal risk appetite and escalation rules. KRIs are forward-looking by design. Ownership typically sits with second-line risk functions, or is jointly held with the business, and breaches get reported to a risk committee rather than a Monday stand-up.
A KCI, or key control indicator, measures whether a specific control is actually working. Think of it as the bridge: RiskHub's comparison of KPIs and KRIs notes that KCIs measure control effectiveness and sit structurally between performance and risk. A failing KCI is often the earliest form a KRI takes.
Worth flagging early: TechTarget's own glossary documents an older use of the KRI acronym meaning "Key Results Indicator," a performance concept entirely unrelated to risk. If you inherit dashboards from an older programme, check which meaning was intended. Mixing the two produces reports that look precise and mean nothing.
Time orientation, in one line each:
- Lagging/present: KPIs mostly report what has already happened or is happening now.
- Leading: well-designed KRIs anticipate a loss event before it occurs.
- Coincident: KCIs report in real time whether a control is functioning at this moment.
Ownership and forum, at a glance:
- KPIs: owned by first-line operational managers; reviewed in business or operations meetings.
- KRIs: owned by second-line risk functions or shared ownership; reviewed at risk committee level.
- KCIs: owned by control owners; breaches trigger remediation rather than committee escalation.
How do KPIs, KRIs and KCIs compare side by side?
| Dimension | KPI | KRI | KCI |
|---|---|---|---|
| Core question | Are we hitting our target? | Is our exposure to a loss event rising? | Is this control operating as designed? |
| Time orientation | Lagging / present | Leading | Coincident |
| Primary owner | First line (business/operations) | Second line, or shared with first line | Control owner |
| Typical example | Sales closed this quarter | Percentage of transactions bypassing approval | Percentage of access reviews completed on time |
| Direction of "good" | Higher usually better | Lower usually better, within an appetite band | Higher usually better |
| Thresholding / escalation | Target vs actual, reviewed by manager | RAG bands anchored to risk appetite, escalated to risk committee on amber/red | Pass/fail bands, escalated to control owner on failure |
| Reporting cadence | Weekly or monthly | Monthly or quarterly | Weekly or monthly |
| Link to controls/capital | Rarely feeds capital decisions | Can feed capital or strategic risk decisions | Feeds directly into control assurance |
A few cells trip people up more than the rest. Absenteeism rate is a good example: Thomson Reuters points out that the same metric can be a KPI in one team's context and a KRI in another, depending on the decision it informs. If a manager tracks absenteeism to manage rota costs, it's a KPI. If compliance tracks concentrated absenteeism in a team handling anti-money-laundering checks, it's a KRI, because it signals rising control failure risk in a sensitive process.
When a single raw number genuinely serves both purposes, split it rather than let ambiguity fester. Report "new accounts opened" as a KPI to sales leadership, and report "new accounts opened without completed KYC" as a separate KRI to risk. Same underlying data feed, two different owners, two different thresholds, two different escalation paths.
What are concrete KRI and KPI examples by function?
Seeing the split applied to your own function usually clarifies it faster than any definition. Here's how it plays out across five common areas:
- HR: KPI is time-to-hire; the matching KRI, per AIHR's analysis, is concentration of high turnover within a single critical team, an early signal of knowledge-loss risk before it hits delivery.
- Operations: KPI is order fulfilment rate; KRI is percentage of orders processed manually due to system downtime, a warning sign for capacity risk.
- IT and security: KPI is patch deployment rate; KRI is percentage of critical systems running unsupported software past end-of-life, which flags rising breach exposure. Reviewing a cybersecurity risk assessment is where most SMEs first surface this gap.
- Finance: KPI is days sales outstanding; KRI is percentage of receivables over 90 days concentrated in a single customer, a concentration-risk signal.
- Sales: KPI is new accounts opened this month; KRI is percentage of those accounts opened without completed KYC, the exact example from the opening of this article.
What is an example of a KRI? The IT one above is worth dwelling on. "Percentage of critical systems running unsupported software" is forward-looking because unsupported software doesn't cause a breach today, it raises the probability of one tomorrow. A good KRI ties to a named failure mode (unpatched vulnerability exploited) and a defined trigger (above 5% of critical systems, escalate to the risk committee within five working days).
How do you design and validate a KRI or KPI from scratch?
Building a workable indicator set is less about picking clever metrics and more about discipline in the steps you take before anything goes on a dashboard.
- Define the decision the indicator needs to support. If no one will act differently based on the number, don't build it.
- Map the failure modes or objectives it relates to. For a KRI, name the specific loss event (fraud, outage, breach, regulatory fine).
- Pick candidate metrics that are already collected, or cheaply collectable, rather than inventing new manual processes.
- Assign a named owner, not a team or department, for accountability when the number moves.
- Calibrate thresholds using either a statistical approach (variance from historical baseline) or an appetite-anchored approach (a board-set tolerance level). Thomson Reuters advises calibration requires both statistical method and judgement, to avoid drowning the signal in noise.
- Back-test against loss history. Would this KRI have flagged your last three incidents? If not, redesign it.
- Define escalation and reporting: who sees a breach, within what timeframe, and what action follows.
- Prune regularly. RiskHub's guidance on indicator design is blunt about this: pick few indicators, and retire any that never move.
Pro Tip: Before rolling a new KRI into your governance pack, run it against twelve months of historical incident data first. If the indicator would have stayed green through an incident you already know happened, the threshold is wrong, not the metric.
What goes wrong when KPI and KRI get confused?
The most damaging pathology is a KPI quietly becoming a de facto risk driver, with no offsetting KRI to catch the downside. RiskHub's comparison uses Wells Fargo's cross-selling targets as the textbook case: a pure performance KPI (accounts opened per employee) with no paired control indicator on account legitimacy, which eventually produced a scandal involving millions of unauthorised accounts. Knight Capital's 2012 trading software deployment is a related failure: deployment speed and go-live KPIs weren't balanced by KRIs on rollback readiness or deployment testing coverage, and a botched release caused substantial financial losses in a very short time.
Treating KPIs and KRIs as two flavours of the same dashboard produces performance bias. KPIs are typically owned by the business line pursuing the target; KRIs should be owned jointly, or independently, and escalated outside that same line.
Do this, not that:
- Do pair every incentivised KPI with a KRI that would catch the downside of gaming it.
- Not that: let a single business line own both the target and the only metric that could flag it going wrong.
- Do prune dashboards to indicators with named owners and a defined action on breach.
- Not that: keep adding metrics until no one reads the report anymore.
What does a practical implementation checklist look like?
Moving from spreadsheet chaos to a working indicator programme takes a defined pilot, not a big-bang rollout across every department at once.
- Choose a pilot scope: one process, one team, 6 to 12 indicators maximum.
- Name each metric precisely, avoiding vague labels like "risk score."
- Assign a single named owner per indicator.
- Document the calculation and data source in plain language.
- Set the reporting frequency.
- Set green/amber/red thresholds with a written rationale for each band.
- Define the escalation path and the response SLA for an amber or red breach.
- Confirm the reporting forum where the indicator will actually be reviewed.
Template fields worth copying straight into a spreadsheet or ticketing tool:
- Metric name
- Owner
- Calculation method
- Data source
- Frequency
- Thresholds (with rationale)
- Escalation path and response SLA
Cadence matters as much as the metric itself. Operational KPIs generally suit daily or weekly review. KRIs work best reviewed weekly or monthly, tight enough to catch drift, loose enough to avoid noise. Board-level summarisation, rolling up both KPI and KRI performance into a single risk and performance narrative, typically happens quarterly.
Why do KCIs matter for bridging controls and risk?
A KCI measures whether a specific control is doing its job, right now. When a KCI starts failing, it's frequently the first sign of a KRI about to move, because a weakening control is exactly what widens exposure. NHIMG's explainer makes the same point: KRIs need to be anchored to control effectiveness and a plausible failure mode, not floated as abstract risk scores.
| Control | KCI | Possible KRI it informs |
|---|---|---|
| Daily reconciliations | Percentage completed by T+1 | Percentage of unreconciled accounts over 5 days |
| Privileged access reviews | Percentage of reviews completed on schedule | Number of privileged accounts with no review in 90 days |
Map each KCI to a control owner, and treat a KCI breach as a trigger for control remediation. A KRI breach, by contrast, should trigger escalation to a risk forum. Confusing the two response paths is how genuine control failures get logged as noise instead of fixed.
How can a GRC platform operationalise these indicators?
Running KPIs, KRIs and KCIs manually across spreadsheets works for a handful of indicators. It stops working once you have thresholds, owners, escalation paths and audit evidence to maintain across multiple frameworks at once. This is where a platform like ShieldIQ earns its keep for EU SMEs juggling NIS2, GDPR and DORA reporting simultaneously.
Capabilities that genuinely matter for this job:
- Automated ingestion of underlying data, rather than manual copy-paste into a monthly report.
- Configurable RAG thresholds tied to appetite, not hardcoded to a vendor's defaults.
- Escalation workflows that route breaches to the right forum automatically.
- Audit-ready reporting output that boards and external auditors can review directly.
- Back-testing features that check whether a proposed indicator would have caught past incidents.
Before a full rollout, pilot with a small indicator set first, and verify integrations and data quality independently. No platform fixes a bad metric definition.
What do practitioners actually do differently in practice?
Most functioning risk programmes I've seen described start smaller than people expect. Run an RCSA workshop, pick 6 to 12 KRIs tied to your worst-case loss events, and pair each incentivised KPI with a KRI that would catch it being gamed. Trying to build a comprehensive indicator library on day one usually produces a dashboard nobody reads by month three.
Pro Tip: When rolling indicators out across multiple teams, stagger the launch by function rather than going live everywhere simultaneously. One team's pilot data becomes the calibration benchmark for the next, and you avoid drowning every committee in new reports at once.
Ready to move from spreadsheets to an audit-ready indicator programme?
Building this manually, tracking thresholds in one spreadsheet, escalation emails in another, evidence for auditors scattered across shared drives, is exactly the overhead ShieldIQ was built to remove for EU SMEs. Instead of chasing owners for updates before every risk committee meeting, ShieldIQ centralises the assessment, thresholding and escalation into one dashboard your team and your auditors can both trust.
What this looks like in practice:
- Automated compliance assessments with scoring and gap analysis, so thresholds update themselves rather than waiting on manual entry.
- Configurable escalation workflows that route amber and red breaches to the right forum automatically.
- Audit-ready reporting templates built specifically for NIS2, GDPR and DORA obligations, ready for a board or external auditor.
- Consulting support if you'd rather have hands-on help designing your first indicator set than building it alone.
If you're an EU-based SME ready to pilot a small indicator set rather than build another spreadsheet, book a consulting call with ShieldIQ or explore the NIS2 compliance platform to see how thresholding and escalation work inside a live dashboard.
Frequently asked questions
What is the main difference between a KRI and a KPI? A KPI measures whether you're achieving a target; a KRI signals that your exposure to a specific loss event is rising, ideally before that loss occurs.
What is an example of a KRI? Percentage of critical IT systems running unsupported software is a common KRI, because it flags rising breach exposure before an actual incident occurs.
Can the same metric be both a KPI and a KRI? Yes. Absenteeism rate, for instance, is a KPI when tracked for rota planning and a KRI when tracked for concentration risk in a compliance-sensitive team.
Who should own KRIs versus KPIs? KPIs are typically owned by first-line operational managers; KRIs are usually owned by second-line risk functions or jointly owned, with escalation routed outside the business line generating the metric.
How many KRIs should an SME actually track? Keep the set small, generally under 12 to start, tied directly to named loss events and risk appetite rather than tracking every available metric.
Sources
- Key performance indicators (KPIs) vs KRIs — RiskHub
- Key risk indicators (KRIs) explained — RiskHub
- Key results indicator (KRI) definition — TechTarget (data technologies)
- KRI vs KPI — AIHR
- Key risk indicators (KRIs) — Thomson Reuters Legal