How to use a 5×5 risk matrix: a practical guide
A risk matrix 5×5 is a grid that scores every risk by multiplying likelihood (1–5) by impact (1–5), producing a score between 1 and 25. If you have a risk in front of you right now, score it, assign an owner, and set a review date. Anything scoring 17–25 is critical, stop the activity or escalate immediately.
Key takeaways
A 5×5 risk matrix scores every risk by multiplying likelihood by impact (1–25), groups results into four actionable bands, and requires a named owner and documented residual score for every risk above the low threshold.
| Point | Details |
|---|---|
| Use multiplication, not addition | Always calculate Risk Score = Likelihood × Impact to keep different risk profiles distinct. |
| Record inherent and residual scores | Log the score before and after controls; regulators and auditors expect both figures. |
| Critical zone (17–25) demands escalation | Scores of 17–25 require senior sign-off and, where possible, suspension of the activity. |
| Calibrate scales before scoring | Agree written definitions for all five likelihood and impact levels before your team starts. |
| ShieldIQ automates the register | ShieldIQ links 5×5 scores to cross-framework controls and generates audit-ready reports automatically. |
Table of Contents
- What is a 5×5 risk matrix and how does it work?
- Why choose a 5×5 matrix over a 3×3 or 4×4?
- How do you define the likelihood and impact scales?
- How to build, score and document a 5×5 matrix step by step
- What action does each score zone require?
- What are the most common pitfalls when using a 5×5 matrix?
- Where can you find ready-to-use templates and tools?
- A GRC practitioner's perspective on making risk matrices actually work
- ShieldIQ makes your risk register audit-ready without the overhead
- Sources
What is a 5×5 risk matrix and how does it work?
A 5×5 risk matrix is a structured grid with two axes: likelihood on one side and impact on the other, each divided into five levels. Every cell in the grid represents a unique combination of those two values. Multiply them together and you get a risk score from 1 (rare event, negligible consequence) to 25 (almost certain event, catastrophic consequence).
The formula is straightforward: Risk Score = Likelihood × Impact. A score of 1 is the lowest possible risk; 25 is the highest. Most teams group scores into four bands: low (1–4), medium (5–9), high (10–16), and critical (17–25). Those bands drive the response, not the raw number.
Consider a small EU-based company migrating its payroll system to a cloud provider. The IT team identifies a risk: data loss during migration. They rate likelihood at 3 (possible, has happened in similar projects) and impact at 4 (significant financial and regulatory consequences under GDPR). The score is 12, placing it firmly in the high band. That single calculation tells the project manager to assign a named owner, implement a backup protocol, and schedule a pre-migration test before go-live.
The 5×5 format is also commonly presented as a colour-coded heat map, where green cells represent low scores, amber represents medium, orange represents high, and red marks critical risks. The visual layout makes it easy to present to stakeholders who do not want to read a spreadsheet.
Why choose a 5×5 matrix over a 3×3 or 4×4?
Not every situation calls for a 5×5. The right matrix size depends on how much nuance your team needs and how much time you can invest in calibrating the scales.
- 3×3 matrix: Three levels per axis (low, medium, high). Fast to complete and easy to explain, but it collapses meaningful distinctions. A risk that is "almost certain" and one that is "possible" both land in the same "high likelihood" cell. Good for quick triage in small teams or early-stage projects where speed matters more than precision.
- 4×4 matrix: Four levels per axis. Slightly more granular, but the even number creates tie problems: there is no natural midpoint, so scorers tend to cluster around the middle two levels, which defeats the purpose of having four.
- 5×5 matrix: Five levels per axis, producing 25 possible cells. The odd number gives a genuine midpoint (3), which anchors scoring and reduces clustering. Atlassian's risk matrix guidance notes that five levels per axis balance nuance with usability, which is why project and safety teams use it by default.
Choose a 5×5 when you are managing complex projects, regulated processes (ISO 27001, NIS2, GDPR, DORA), or any situation where an auditor may review your register. Choose a simpler 3×3 when you need a quick team conversation rather than a formal document.
How do you define the likelihood and impact scales?
Consistent scoring depends entirely on how well you define each level before anyone picks up a pen. Vague labels like "unlikely" mean different things to different people. Anchored definitions with example percentage bands remove that ambiguity.
Likelihood scale (1–5)
| Level | Label | Indicative frequency | Example |
|---|---|---|---|
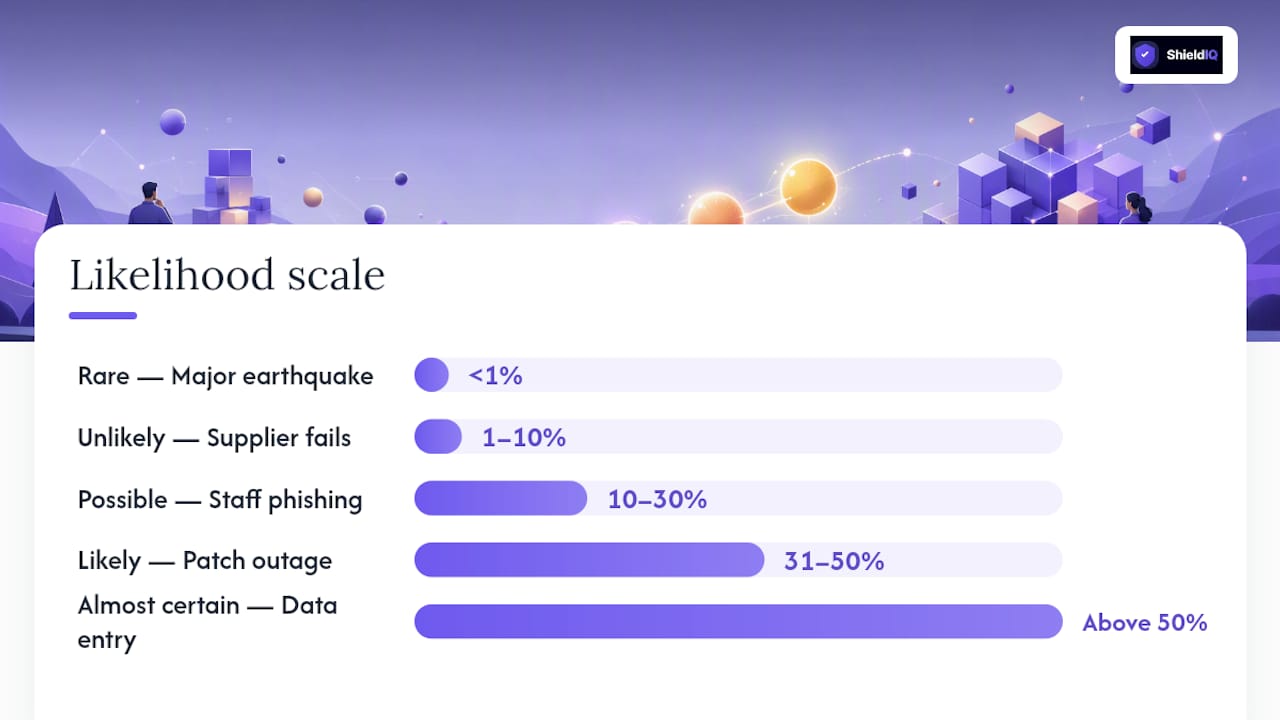
| 1 | Rare | Less than 1% chance per year | Major earthquake in central Europe |
| 2 | Unlikely | 1–10% chance per year | Critical supplier goes insolvent |
| 3 | Possible | 10–30% chance per year | Phishing email reaches a staff member |
| 4 | Likely | 31–50% chance per year | Patch deployment causes a brief outage |
| 5 | Almost certain | Above 50% chance per year | Human error during manual data entry |
Impact scale (1–5)
Inherent vs residual risk. Inherent risk is the score before any controls are in place. Residual risk is the score after controls are applied. Always record both. Tools that align to ISO 31000 and ISO 45001 require this distinction explicitly, because it forces teams to demonstrate that their controls actually reduce the score rather than simply noting that controls exist.
How to build, score and document a 5×5 matrix step by step
The seven steps
- Identify risks. Gather your team and list every risk relevant to the activity, project or process. Use a structured prompt: "What could go wrong, when, and for whom?"
- Define your scales. Agree the likelihood and impact definitions before scoring begins. Use the tables above or adapt them to your sector.
- Score each risk. For each risk, assign a likelihood level (1–5) and an impact level (1–5). Multiply them: Risk Score = L × I.
- Plot on the grid. Place each risk in the corresponding cell of your 5×5 grid. Risks in the same cell share a score but may differ in profile; note both values separately.
- Prioritise by zone. Sort risks by score, highest first. Critical and high risks need immediate attention; medium risks need a plan; low risks need monitoring.
- Assign owners and deadlines. Every risk above the low band must have a named owner and a target date for the next review or mitigation action.
- Document and review. Record the inherent score, the controls in place, the residual score, the owner, and the next review date in your risk register. Schedule reviews at least annually for low risks, quarterly for high, and monthly (or on-trigger) for critical.
Worked example
Risk: Unauthorised access to customer data via a compromised staff account.
- Inherent likelihood: 4 (staff accounts are targeted regularly; no multi-factor authentication in place)
- Inherent impact: 5 (GDPR breach, potential regulatory fine, reputational damage)
- Inherent score: 4 × 5 = 20 (Critical)
Control applied: multi-factor authentication (MFA) rolled out to all accounts.
- Residual likelihood: 2 (MFA significantly reduces successful account compromise)
- Residual impact: 5 (consequence of a breach remains the same)
- Residual score: 2 × 5 = 10 (High)
The residual score of 10 still sits in the high band, so the owner (IT Manager) must schedule a quarterly review and document the MFA rollout as evidence. For a deeper look at how cybersecurity risk assessments feed into this kind of register, the ShieldIQ guide for non-technical leaders covers the full process.
What action does each score zone require?
The score alone does not tell you what to do. The zone it falls into determines the governance response.
| Score range | Colour | Zone | Required action | Review frequency |
|---|---|---|---|---|
| 1–4 | Green | Low | Monitor; no immediate action needed | Annual |
| 5–9 | Yellow | Medium | Document controls; assign owner; schedule review | Bi-annual |
| 10–16 | Orange | High | Implement mitigation; named owner; evidence required | Quarterly |
| 17–25 | Red | Critical | Escalate immediately; stop or suspend activity if possible; senior sign-off required | Monthly or on-trigger |
Governance checklist by zone:
- Low: Log in register; confirm no controls are needed or note passive monitoring.
- Medium: Assign owner; document existing controls; set review date.
- High: Assign owner; document controls and evidence; line manager sign-off; quarterly check-in.
- Critical: Escalate to senior leadership or board; document decision and rationale; evidence of mitigation; do not proceed without sign-off.
Under the Management of Health and Safety at Work Regulations 1999, employers must carry out suitable and sufficient risk assessments and retain records. That statutory requirement applies directly to the high and critical zones: if you cannot show documented evidence of your response, the assessment is not legally sufficient.
What are the most common pitfalls when using a 5×5 matrix?
Even well-intentioned teams make the same mistakes. Knowing them in advance saves you from a register that looks thorough but fails under scrutiny.
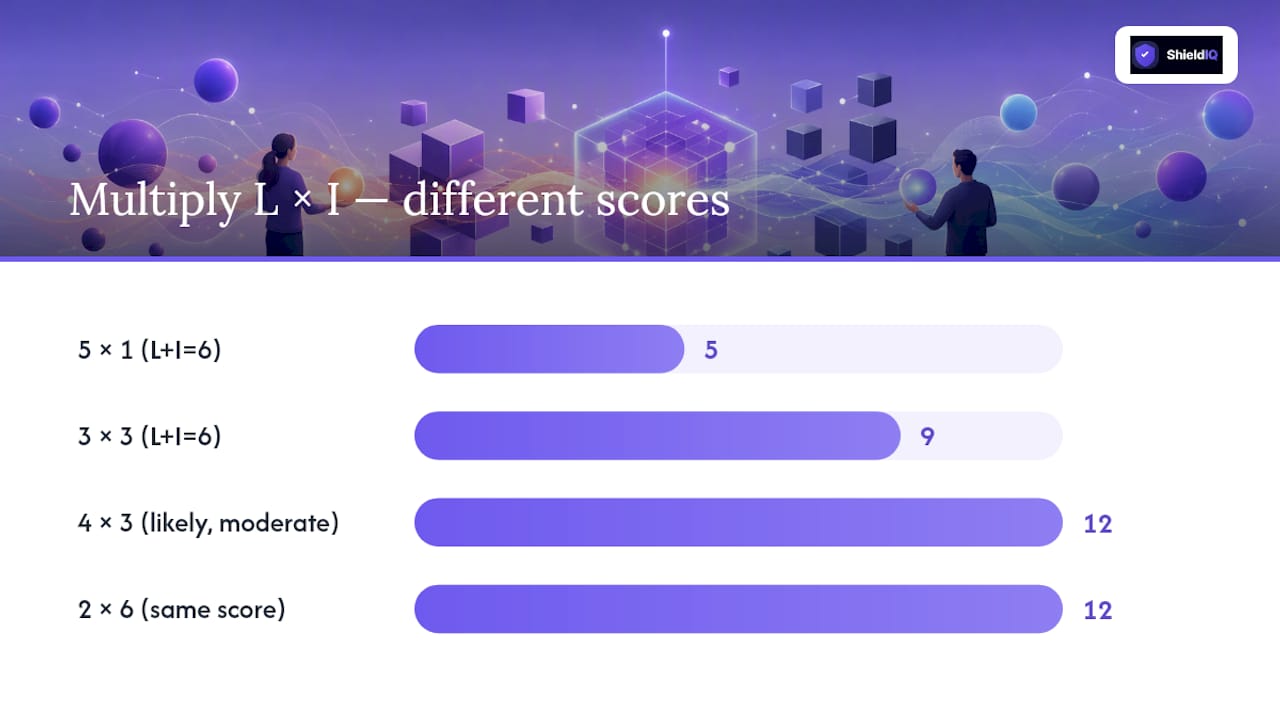
- Adding instead of multiplying. L + I = 6 for both a 5+1 risk and a 3+3 risk, yet those are very different profiles. Multiplication (L × I) keeps them distinct: 5 and 9 respectively. Always multiply.
- Undefined scales. If "likely" means different things to different team members, your scores are not comparable. Anchor every level with a definition before scoring starts.
- Scoring the same risk twice under different names. Canonical naming matters: "data breach" and "unauthorised data access" are the same risk. Duplicates inflate your register and distort priorities.
- Ignoring residual risk. Recording only the inherent score gives a misleading picture. A critical inherent risk with strong controls may sit comfortably in the medium band after mitigation.
- Treating all same-score risks as identical. A 4×3 risk (likely, moderate impact) and a 2×6 risk are both 12, but their management differs. Always record the individual L and I values alongside the score.
HSE research report RR151 identifies inconsistent scoring and poor documentation as the two most common weaknesses in workplace risk assessment practice. Both are fixable with a short calibration exercise before your team starts scoring.
Calibration checklist:
- Run a blinded scoring exercise: give two team members the same risk description and compare their scores independently.
- Review five completed assessments from your register and check that scale definitions were applied consistently.
- Document the rationale for every score above 9, not just the score itself.
- Record the date of each assessment and the name of the assessor.
Pro Tip: Set a "tie-breaker" rule in your register: when two risks share the same score, the one with the higher impact level takes priority. A score of 12 from 3×4 (possible, significant) is more urgent than 12 from 4×3 (likely, moderate) because the consequence is harder to reverse.
Where can you find ready-to-use templates and tools?
You do not need to build a 5×5 grid from scratch. Several reliable sources offer free, downloadable templates suited to different working styles.
- Excel/CSV templates: Best for teams that want to maintain a live risk register with filtering, sorting and version control. Atlassian's downloadable template is a practical starting point; it exports to CSV for import into other platforms.
- PDF templates: Useful for sign-off workflows where a printed or signed document is required. Central Bedfordshire Council's risk assessment template shows how likelihood and impact descriptors are presented in a local authority context.
- Web calculators: Tools such as the IIENSTITU risk management calculator let you score, sort and export risks interactively, which is useful for one-off assessments or training exercises.
- SafetyCulture (iAuditor): A mobile-first platform widely used in construction, manufacturing and facilities management. It provides pre-built 5×5 templates and lets teams complete assessments on-site, with automatic scoring and report generation.
- CHAS: The Contractors Health and Safety Assessment Scheme uses risk assessment documentation as part of its accreditation process. CHAS-aligned templates are available through its member portal and are formatted to meet UK contractor compliance requirements.
Spreadsheets vs a GRC platform. A well-maintained Excel register works for a single team managing a handful of risks. It breaks down when you need to track residual scores across multiple frameworks, send automated reminders to owners, or produce audit-ready reports on demand. A GRC platform automates those steps, links controls to scores, and maintains a timestamped audit trail without manual effort. For teams managing vendor risk or aligning to frameworks like ISO 27001 or NIS2, the gap between a spreadsheet and a platform becomes significant quickly.
A GRC practitioner's perspective on making risk matrices actually work
Most SMEs I work with build their first risk register correctly and then abandon it within six months. The matrix is not the problem. The problem is that no one owns the review cycle.
Two things make the difference in practice. First, keep your register short. A register with 200 risks is not more thorough than one with 30; it is less useful, because no one reads it and owners stop feeling accountable. Focus on risks that score 9 or above and review the rest annually. Second, set a fixed review cadence and put it in someone's calendar before the register goes live. Quarterly for high risks, monthly for critical. If a review is missed, the register is out of date and legally insufficient under the Management of Health and Safety at Work Regulations 1999.
For SMEs that want to move beyond spreadsheets, a platform like ShieldIQ can automate residual scoring, send owner reminders, and generate audit-ready reports without requiring a dedicated risk manager. That is not the only route, but it is the most practical one for teams without a full-time GRC function.
ShieldIQ makes your risk register audit-ready without the overhead
Running a 5×5 risk register in a spreadsheet is a reasonable starting point. But when your register needs to feed into NIS2, GDPR, ISO 27001 or DORA compliance evidence, manual tracking creates gaps that auditors notice. ShieldIQ's GRC platform automates residual risk scoring, links controls to individual risks, and maintains a timestamped audit trail that updates as your team works. There is no need to chase owners for updates or rebuild reports before every audit. For SMEs that need structured compliance support alongside the platform, ShieldIQ's consulting services include risk register setup, gap analysis, and audit preparation. Book a demo to see how your 5×5 workflow maps to your compliance obligations.
Sources
The following resources are worth bookmarking, whether you are building your first register or aligning an existing one to a regulatory framework.
- Risk Matrix: How to Score Probability and Impact (Template)
- Risk assessment matrix: Free template and usage guide | TechTarget
- Risk matrix (Atlassian) — template and usage
- Legislation
Recommended
- How to Build a Risk Register: A Practical Guide for SMEs | ShieldIQ
- Risk Register Setup for SMEs: Audit-Ready in a Week
- What Is a Cybersecurity Risk Assessment? A Practical Guide for Non-Technical Leaders | ShieldIQ
- Vendor Risk Management: Why Your Suppliers Are Your Biggest Security Liability | ShieldIQ